






In SaaS companies, it is regularly implemented to prevent potential customers from abandoning the registration and demo steps. test site speed process should be performed and the connection between Core Web Vitals data and conversion rates should be analyzed. In software-focused platforms, user experience is perceived as a direct reflection of product quality. Any delay in page load times negatively affects not only SEO performance, but also monthly subscriber acquisition costs (CAC). In this guide, we will examine how to measure the impact of speed on sales and how to overcome technical bottlenecks.
Why Does Testing Our SaaS Site Speed Impact Direct Sales Productivity?
In SaaS platforms, speed directly affects sales efficiency because users expect the interface to be fluid and instantly responsive in order to trust a cloud software. Especially the slowness of the free trial or demo registration pages causes the potential customer to think that the software itself will be cumbersome. A slow registration form immediately demotivates the customer to purchase and leads him to turn to competing tools.
For example, let's consider a B2B SaaS startup that gets 10,000 unique visitors per month. On the registration page of this initiative, it can be observed that when the Maximum Content Painting (LCP) time was reduced from 4.2 seconds to 1.8 seconds, the rate of opening a free trial account increased from 3.2% to 4.8%. This simple speed improvement allows you to earn 160 additional trial accounts per month without increasing the ad budget. B2B SEO Strategy for SaaS Companies This technical efficiency should always be kept in the foreground when designing.
Which Google Metrics Should You Look at When Speed Testing SaaS Sites?
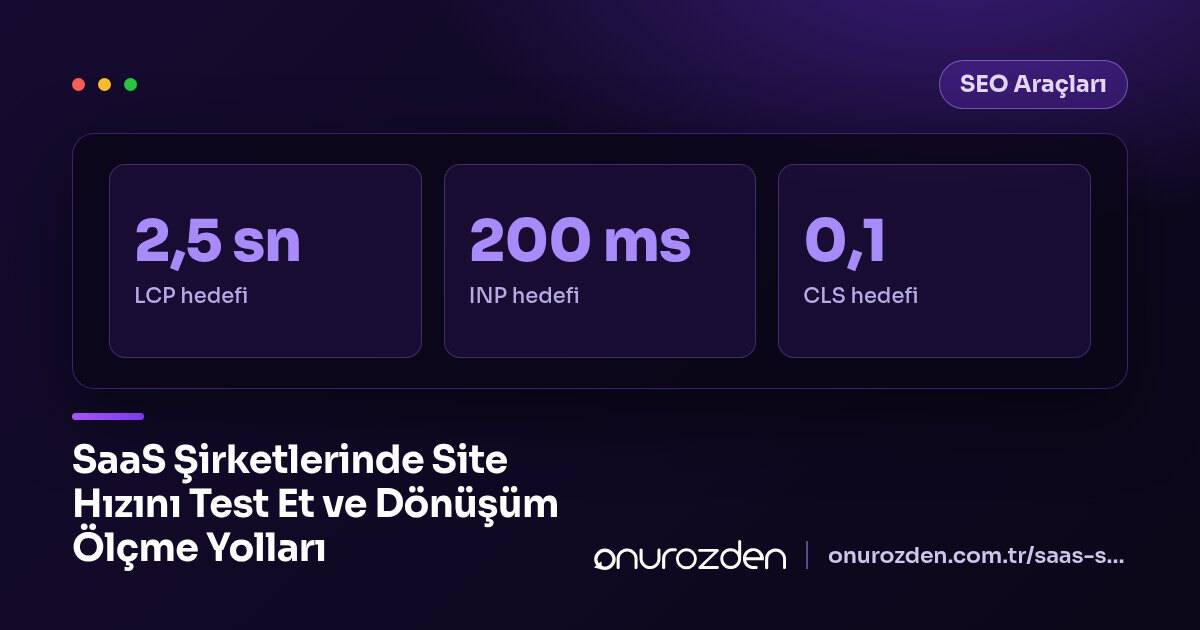
The main metrics to focus on when performing performance analysis on SaaS sites are the LCP, INP and CLS values under the Core Web Vitals umbrella. Since software interfaces generally contain dense JavaScript and interactive components, not only the page opening speed but also the response time the user receives when pressing the buttons is vital. The table below shows the importance of these metrics in the SaaS conversion steps and their ideal value ranges:
| Metric | Conversion Step Effect | Ideal Value | Critical Threshold |
|---|---|---|---|
| LCP (Largest Contentful Paint) | Registration page main image or form visibility | < 2.5 sec | > 4.0 sec |
| INP (Interaction to Next Paint) | Response speed when clicking on the submit form button | < 200ms | > 500ms |
| CLS (Cumulative Layout Shift) | Preventing false clicks (form shifts) | < 0,1 | > 0,25 |
How to Perform Step by Step Speed Test and Conversion Loss Analysis?
For a systematic analysis process, technical teams and marketing managers need to follow a certain flow. The first step is to take a clear picture of the current situation. Page Speed & Core Web Vitals Using our tool, you can enter the URL address of our site and see Google Lighthouse and real user data in seconds. The tool will show you in detail which file is delaying loading and which image needs to be optimized.
Speed Optimization Audit Checklist
- Converting the visual files in the main registration form to WebP format.
- Cleaning up unused third-party analytics pixels.
- Optimizing database queries to reduce server response time (TTFB).
- Minification and compression of CSS and JavaScript files.
- Using a reliable CDN structure for delivering static content.
After each of these steps is implemented, the change in form completion rates should be monitored via Google Analytics as the speed increases. If there is a server-related slowness, contact a professional. server optimisation Getting support will radically improve the operating performance of the software.
How to Track the Conversion Impact of Slow Pages on Google Tag Manager and GA4?
In order to base marketing decisions on data, it is necessary to transfer speed metrics directly to analysis tools. The following block of code allows you to capture LCP time occurring in users' browsers via Google Tag Manager and send it as an event to Google Analytics 4 (GA4). In this way, you can segment how many conversions you receive at which speed value.
new PerformanceObserver((entryList) => {
  for (const entry of entryList.getEntries()) {
    window.dataLayer = window.dataLayer || [];
    window.dataLayer.push({
      'event': 'core_web_vitals',
      'cwv_metric': 'LCP',
      'cwv_value': Math.round(entry.startTime)
    });
  }
}).observe({type: 'largest-contentful-paint', buffered: true});
The first line of code launches the browser's performance monitor, which tracks when the largest image or text block within the page is loaded. The loop in the third line adds each detected performance input to the data layer. The section between the fifth and seventh lines passes the measured LCP millisecond value to the repository along with an event name that can be read by GA4. The last line ensures that this observation also works to include historical data stored while the page is loading.
Common Mistakes in SaaS Speed Optimization and Ways to Fix them
The biggest mistake made in SaaS projects is to add a new external script for every marketing need. This makes the main code structure of the site heavier and tires the browser. Common errors and their solutions are:
- Mistake: Chat bots and heat map tools are loaded as soon as the page is opened. Correction: Set these widgets to load when the user interacts with the page or after 5 seconds have passed (lazy load).
- Mistake: Pulling font files from external servers. Correction: Host the fonts on your own server and upload only the necessary weights.
- Mistake: Dynamic calculations in pricing tables are done on the client side with a very heavy JavaScript. Correction: Choose modern and lightweight libraries for simple mathematical operations.
Building a performance-oriented SaaS infrastructure ensures that users stay on the platform longer and make more transactions. You can make your digital growth permanent by making speed improvements a continuous process. You can contact our agency for monthly SEO packages that provide professional support and increased productivity.
What is the ideal loading time for SaaS registration pages?
For ideal user experience, LCP duration should be under 2.5 seconds. More than 40% of users tend to abandon the page if it takes more than 3 seconds to load.
How does excessive use of JavaScript affect site speed and conversions?
The density of JavaScript increases the processing load of the browser, prolongs the INP time and causes the buttons to react late. This situation, especially in registration forms, causes the user to leave the page before submitting the form.
Does an apparent high score on a speed test guarantee that the conversion rate will definitely increase?
A high score is a technical indicator, but in addition to speed, user interface (UI) and value proposition are also important for conversion. However, increased speed enables increased potential by removing technical barriers to conversion.